


Recent changes to the way Texas scores applications for housing tax credits appear to have had a slight but notable impact on the number of proposed developments in the most affluent parts of the state.
This year’s applications to the Texas Department of Housing and Community Affairs (TDHCA) for 9% Low Income Housing Tax Credits (LIHTC), a federal subsidy distributed by the state agency, were due on March 1. While TDHCA received 380 pre-applications over the past several months, only 148 full applications were ultimately submitted.
Our recent report on TDHCA’s scoring system for tax credit applications found that after several changes were implemented in 2013, in response to a fair housing lawsuit against the state, more tax credit developments were built in higher income, majority white neighborhoods. (watch a video explaining our report here).
But policy shifts in this year’s Qualified Allocation Plan (QAP), the rules for scoring tax credit applications, may have slowed or reversed those trends. The changes to the 2017 QAP include:
- Restructuring the Opportunity Index points, with applications able to score points for “area amenities” even if located in higher poverty areas with lower median incomes than was previously allowable,
- Additional points for proximity to the urban core, and
- Fewer points for a development’s proximity to a high-quality school.
In addition to the QAP adjustments, the scoring system was impacted by the implementation of HB 3535, legislation passed in 2015 that guarantees one Concerted Revitalization Plan (CRP) project for every county with more than 1.7 million people and urban areas with more than 500,000 people.
Given these changes, some things stood out from this year’s crop of applications:
 Decrease in the percentage of applications in highest income areas
Each year, TDHCA releases an HTC Site Demographics Characteristics Report that breaks down Census tracts into median household income quartiles (MHIQ). From 2013 to 2016, only developments located in the top two quartiles (Q1 and Q2) could score Opportunity Index points, but this year’s changes allowed points for third-quartile (Q3) developments as well. The applications in Q1 tracts went from 58 percent of the total in 2016 down to 41 percent in 2017 (see table to right. Source: TDHCA March 2016-2017 Full Application logs).
Increase in applications in lowest income areas
Correspondingly, the percentage of applications in Q3 and Q4 tracts increased in the past year, jumping from 15 percent in 2016 to 25 percent in 2017.
Little change in target populations
The 2013 QAP changes improved the proportionality of tax credit housing targeted at the elderly, which had previously been much higher than the actual elderly renter population because senior housing is often more politically viable to construct. Since then, the proportion of general vs. elderly housing has more closely matched real demographics (although still over representative in most areas), and that does not appear to have changed between 2016 and 2017. In both years, 32 percent of applications were for developments limited to the elderly. Sixty percent of this year’s applications are for general population housing, just one percentage point down from last year.
Few CRP deals
There were only four applications that included Concerted Revitalization Plans in this year’s cycle. The CRP point provision in the QAP allows tax credits to be awarded to areas with a revitalization plan, developed and adopted by a city government, that meets TDHCA guidelines. The projects are generally located in Census tracts that would not qualify to score Opportunity Index points due to their location.
No prominent concentration
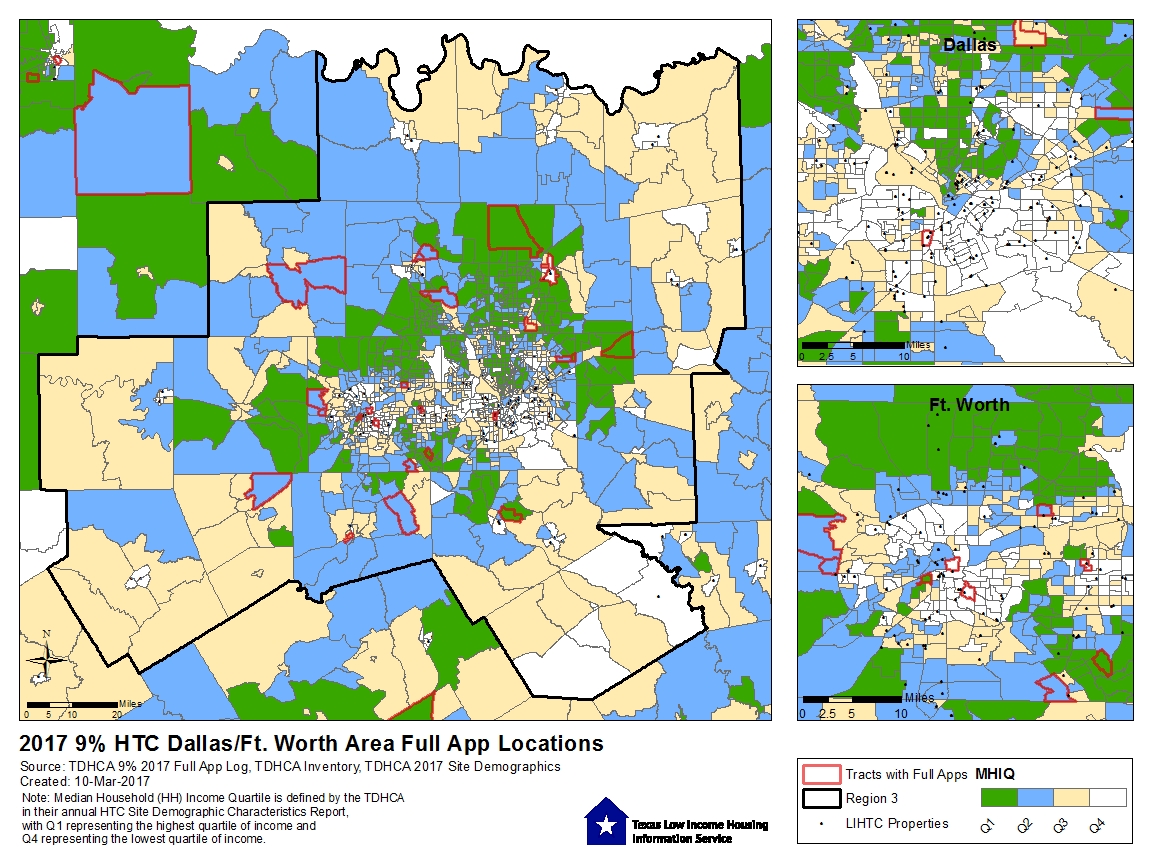
The concentration of tax credit developments in low income, racially segregated Census tracts has been a major fair housing concern in Texas. But as our report shows, the QAP changes have reduced such concentration in the past few years. In the 2017 cycle, there are some visible concentrations of applications in parts of Fort Worth and East Austin. But because these are applications which will now enter a competitive scoring process, it does not necessarily mean a concentration of final awards.
The following maps show the tract locations of this year’s applications in the state’s four largest metropolitan areas and tract MHIQ, with the dots representing already-existing LIHTC developments.
Austin:

Dallas-Fort Worth:
Houston:

San Antonio:


[…] by susanwwatkins | March 13, 2017 […]
[…] in the program is achieved (especially since TDHCA’s most recent allocation plan already lowers the educational quality point total). The bill was left pending and does not have a Senate […]